Bear Time
If you ask me, we have been in the bear market for a while now. To specify, I think the bear market started in January 2022, like most bears do.
A few weeks ago I did some research on all the past bear markets visible on the S&P500, in order to get a better understanding of what exactly is happening. I wasn’t able to conclude a lot, but the data I retrieved might be valuable.
Conclusion No.1
First of all, almost every bear market ends when a weekly candle closes above the downward sloping resistance. On The $SXP Every single one did, except for the bear market of 1909, 1959 and 1977. Every exception just has one weekly candle that breaks the resistance line without much volume and just falls back into the downtrend the week after. Experienced traders probably even recognised that those “break-outs” were “fake outs”. So why is this relevant?
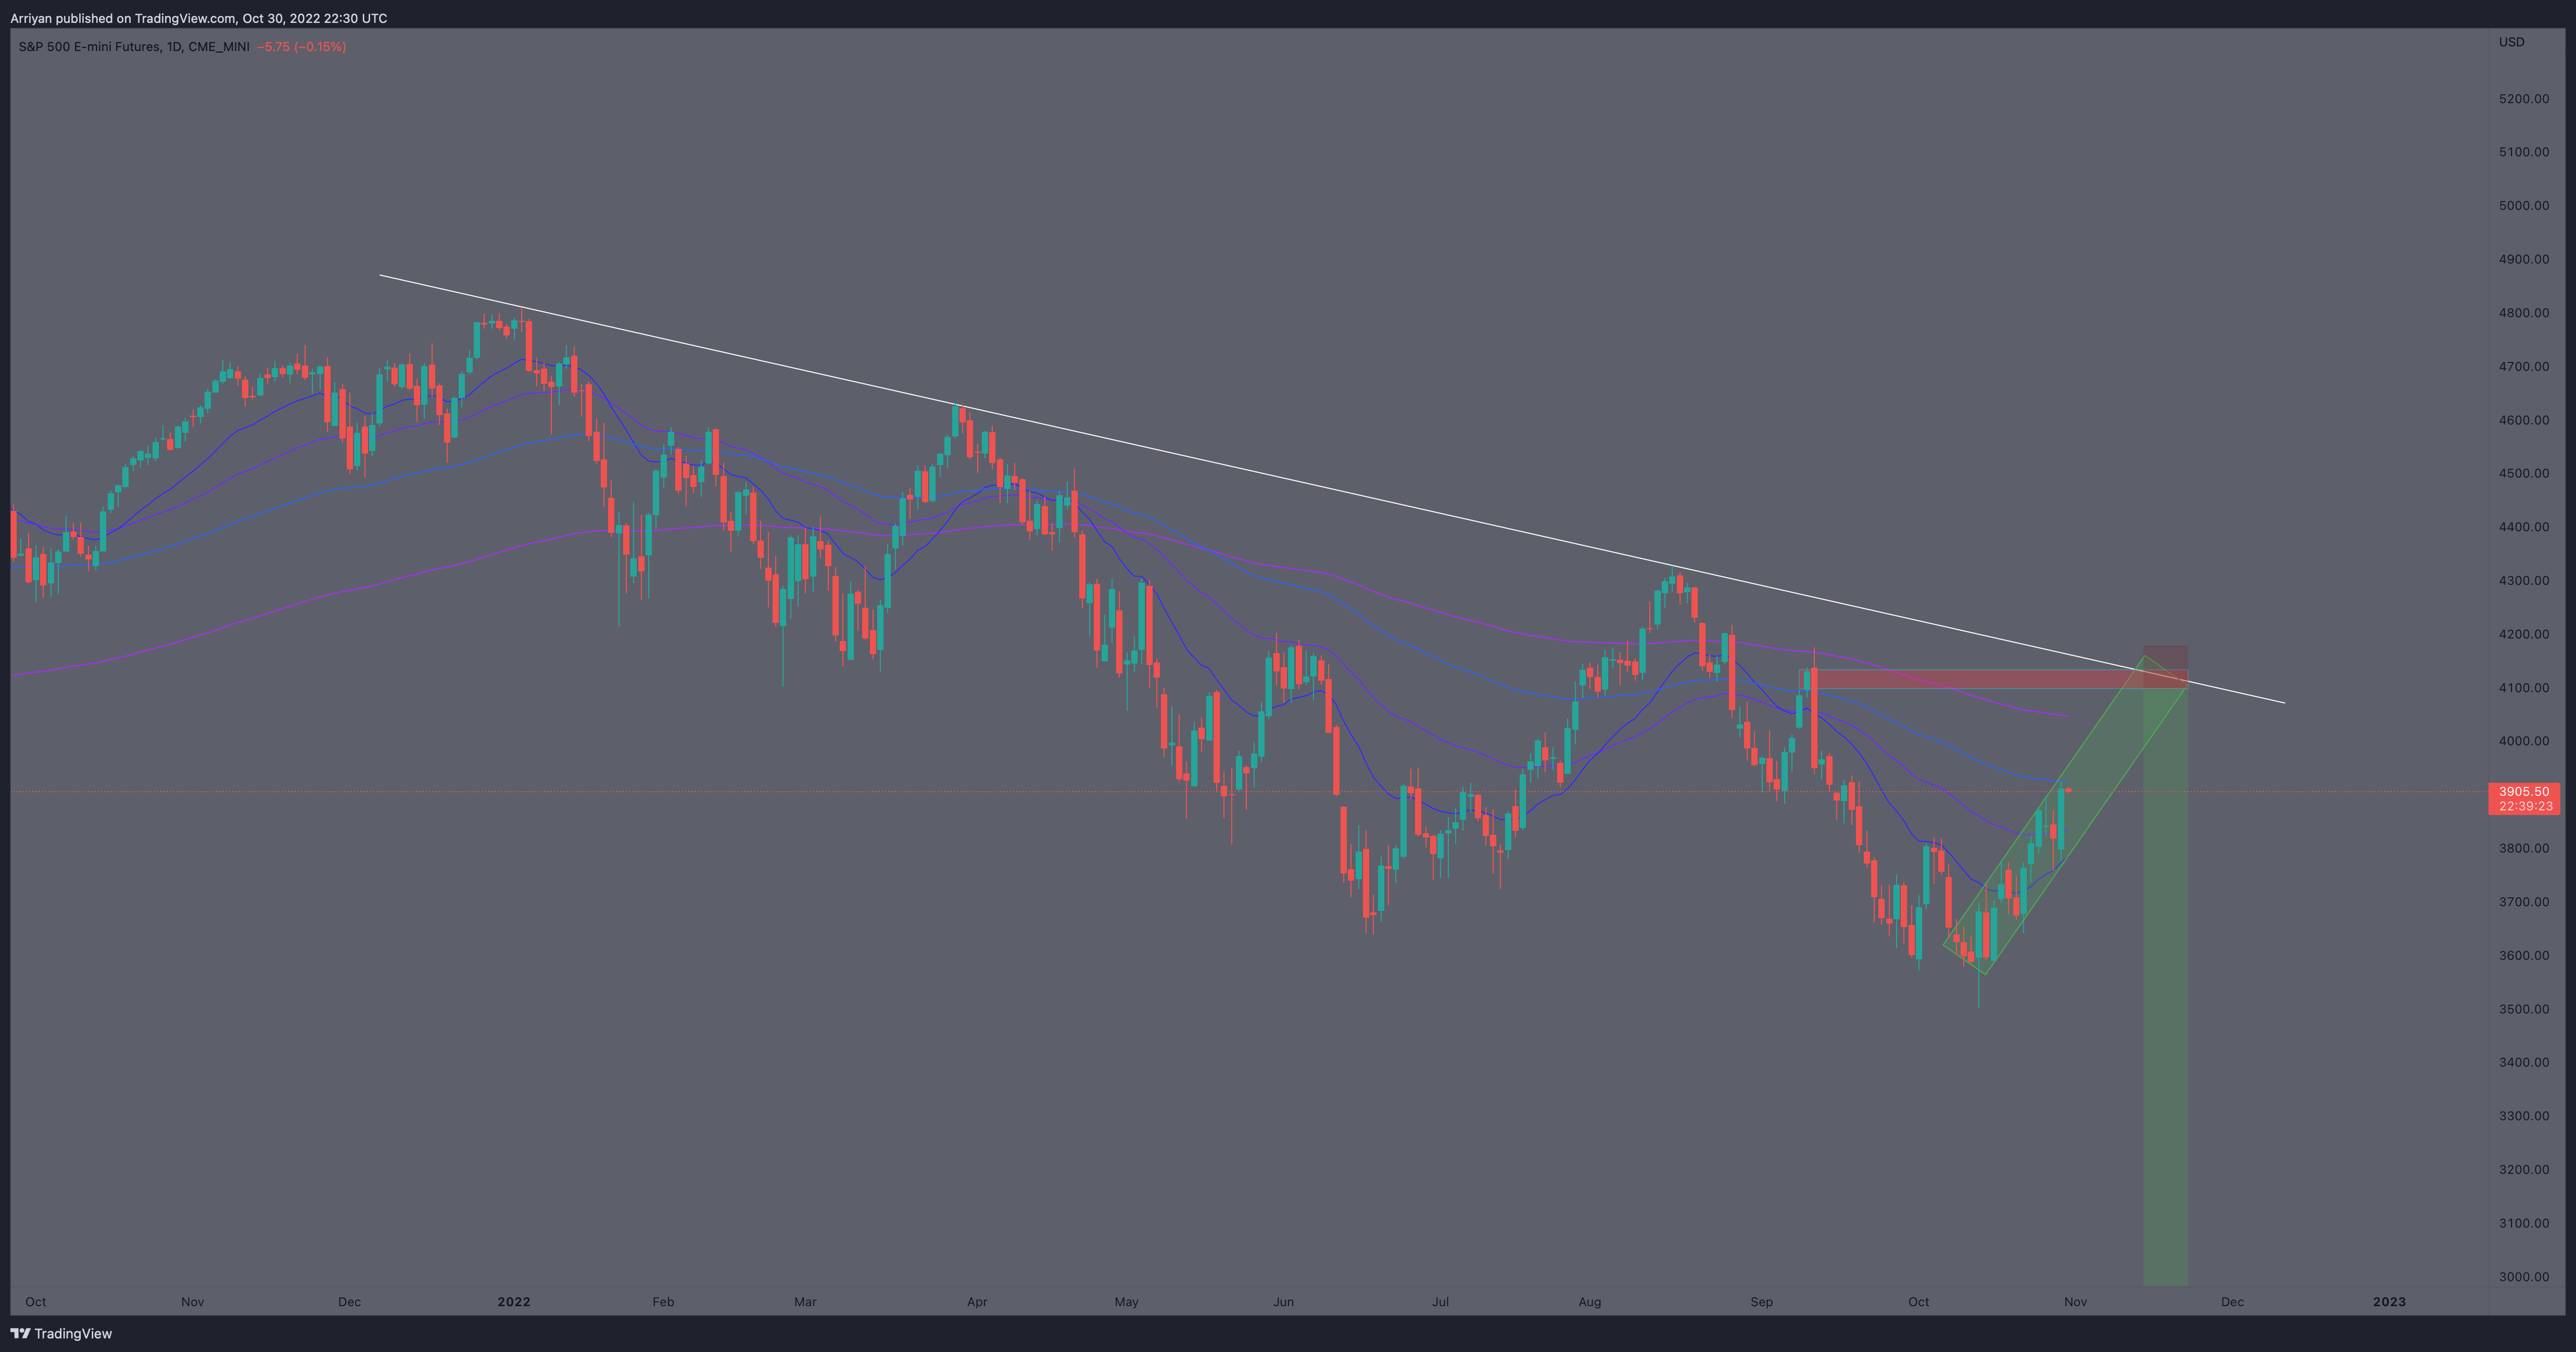
We are currently heading towards a very important crossing point displayed the chart below.

This so called ‘downward sloping resistance’ has been respected three times already, giving me the conclusion that it is a valid and strong resistance line.
I believe that if we break the resistance line and close above with a weekly candle, the bear market will be called off. On the other hand I calculate the odds of that happening very narrow. The Macro outlook is terrible and the drama is yet to come, I fear.
I don’t want to get too technical on this Blog, so for a more detailed and technical analysis on the chart you can visit the Discord Server. But this I will share here, if we actually visit the red box I drew on the chart, I will be entering a large SHORT position. In my opinion this would be the ultimate entry, as high as you could possibly get it without invalidating the other technicals for the time being.
Conclusion No.2
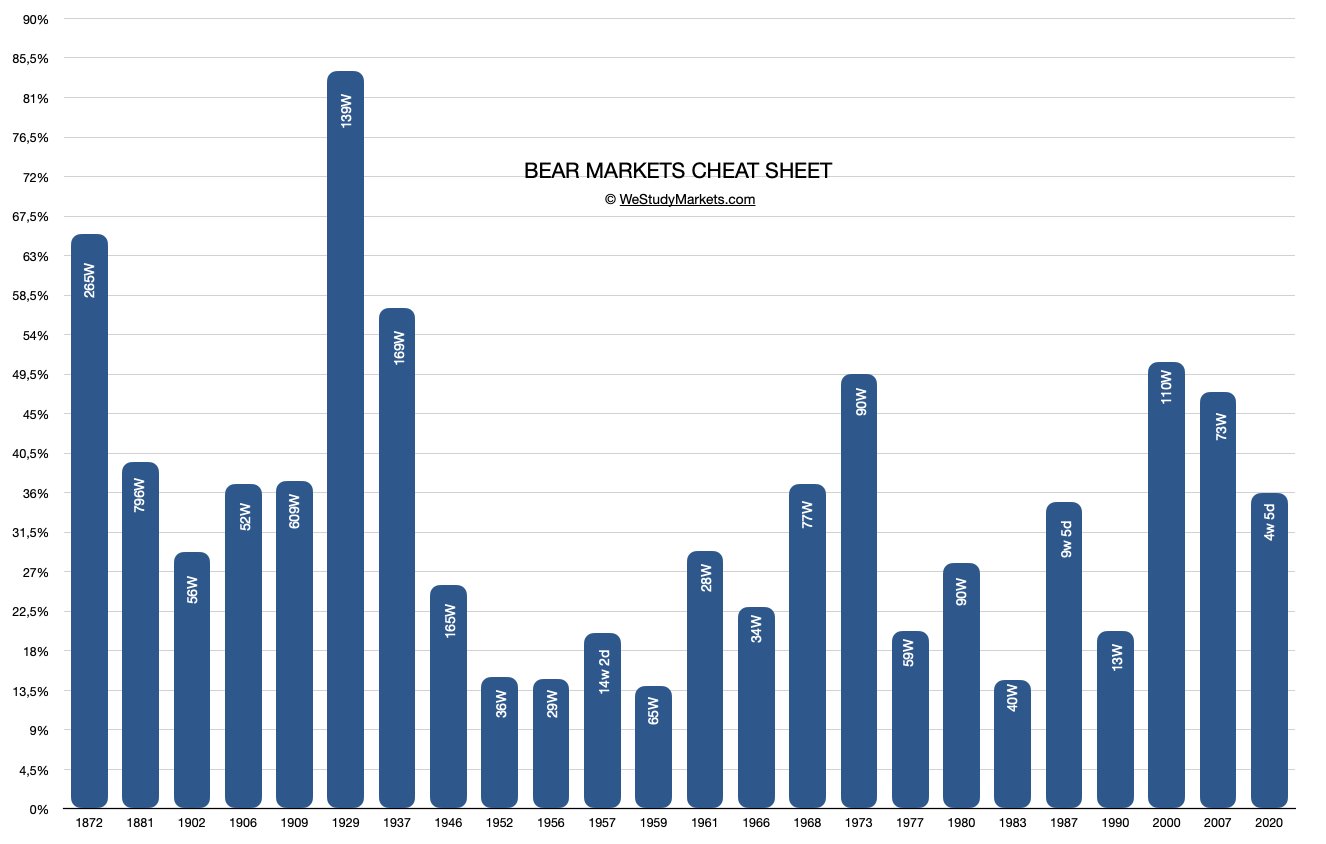
This one actually isn’t a conclusion, but just an overview of the durations and declines bear markets took. On the Y-Axis the percentage of the decline is showed and on the X-Axis you can view which year it was. In the bars, the duration of the bear markets is displayed in weeks.

I will publish the paper on the bear markets on the website in a few days, so stay tuned for that.


